CMME: Audio Toolkit
Audio is a major feature of the final exhibit for the Museum of Science’s portion of the Creating Museum Media for Everyone (CMME) project. The audio components help guide visitors through their interaction with the exhibit. We found that many of the audio components were important for almost all visitors, in addition to those who had low or no vision. Audio is also useful for visitors who are dyslexic and with other cognitive disabilities that affect the ability to read. This post outlines the final audio components, including text and audio files, we included in the exhibit. The findings that led us to most of our audio decisions are outlined in a previous post summarizing the formative evaluation of the CMME exhibit.
In this exhibit we used audio in three distinct ways:
- Audio phone text
- Broadcast text audio
- Broadcast sonified audio
Audio phone text
Audio phone text accompanies almost all of the exhibits at the Museum of Science. This audio gives an overview of the exhibit component, including the physical layout, label copy text, image descriptions, and potential interactions visitors may have at an exhibit. This audio is typically accessed through an audio phone handset and visitors can advance through the audio files by pressing the buttons mounted on the exhibit near the handset holder.
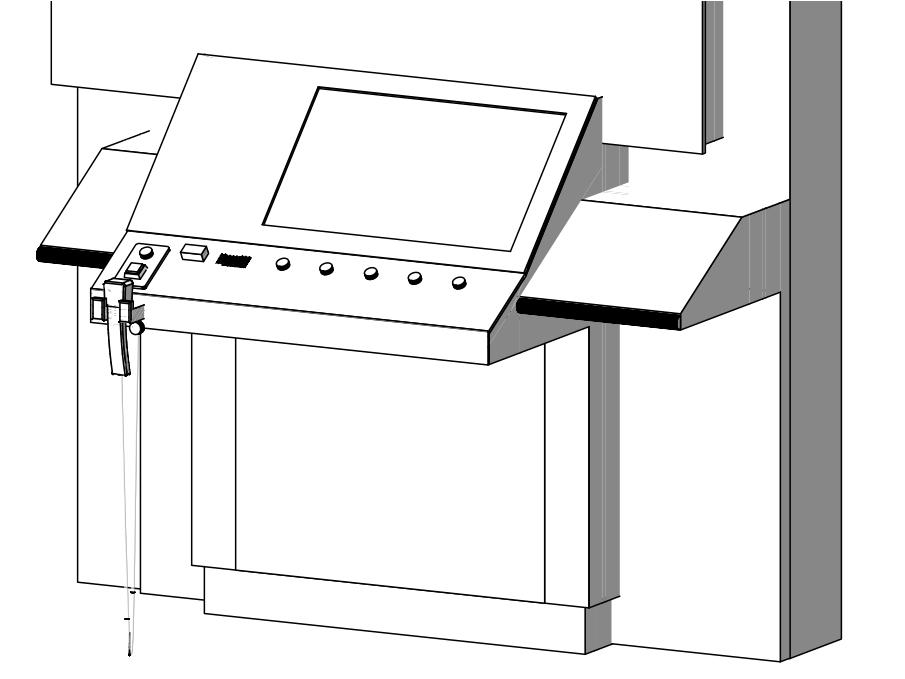
This drawing of the CMME exhibit shows the audio phone handset on the front left edge of the exhibit component. There are two buttons mounted on the slanted surface above the handset that trigger the audio files to play when they are pressed.
The audio phone used for this exhibit has two buttons. The square button audio file contains a physical description of the exhibit so that visitors can orient themselves. The round button contains five audio files that articulate the text, images, and a brief introduction to possible visitor interaction at the exhibit. A file with the full audio phone text can be viewed and downloaded by clicking here. You can also listen to a sample audio file from the audio phone by clicking here (this matches the “Square button” section in the full audio phone text document).
Broadcast text audio
Broadcast text audio provides live feedback in response to a visitor’s action. This feedback includes when a visitor touches the touch screen or pushes a button. This feedback often gives details about their selection and provides additional information about how they might interact with the exhibit. A file with the full broadcast audio text can be viewed and downloaded by clicking here. You can listen to sample audio files from the broadcast audio by clicking on the following links for the button instructions, the introduction to the graph, and a graph title (these match the text in the corresponding sections of the full broadcast audio text document). The dynamic nature of the audio feedback meant some of the phrases and instructions were recorded in separate files and then pieced together in real time through the programming. For example, if a visitor holds their finger in one point on the graph, they will hear seven audio files strung together to describe the date in that area: “Turbine produced – 756 – watts in winds of – 25 – miles per hour – 4 – data points.” We chose not to use any computer generated vocalizations for the text and we recorded all of the audio with the same human voice.
Some exhibits at the Museum of Science have the broadcast audio as an “opt in” feature and visitors have the option to turn the audio on by pressing a button. For this exhibit, we found the introduction to the graph was so important to visitor understanding of the exhibit, we decided to leave the broadcast audio on all of the time. This factor improves understanding for many visitors, but may also limit interactions with the exhibit by visitors who may not want to listen to the audio or who may become overwhelmed by too much auditory stimulation. This concern led us to edit the amount of information we readily broadcast. Additional broadcast audio instructions can be accessed through a “More Audio” button located near the audio phone handset.
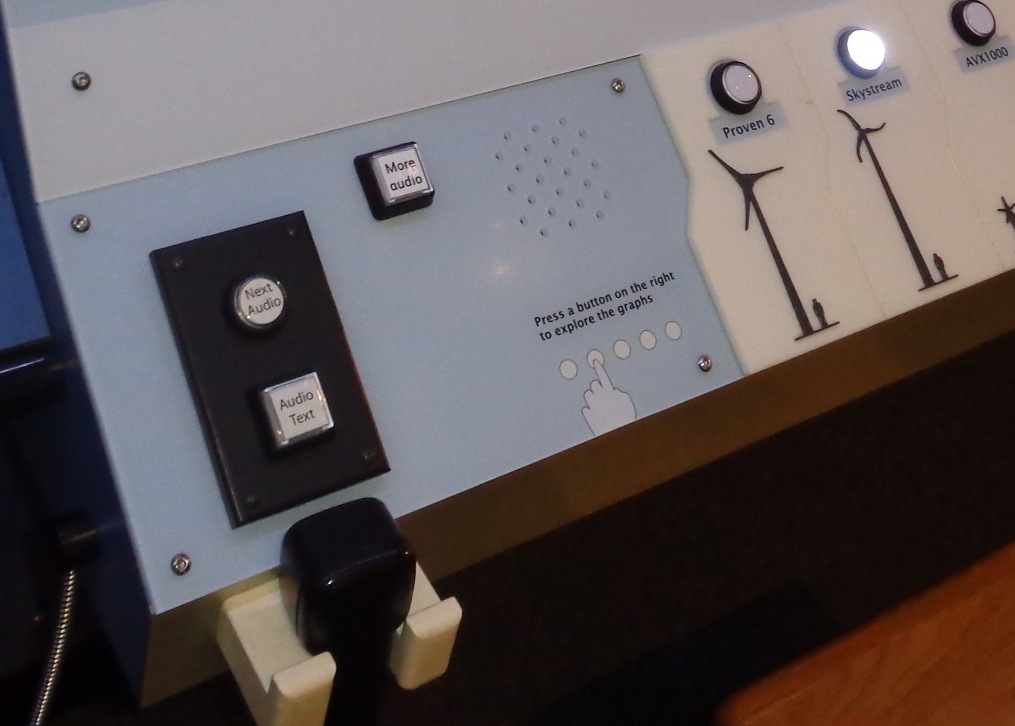
Picture of the front left corner of the CMME exhibit. The audio phone handset and corresponding control buttons are on the far left. The “More Audio” button is a few inches to the right and the cutout holes in the surface, where the speaker is mounted into the tabletop for the broadcast audio, are visible next to the buttons.
Although our feedback was dynamic, we were unable to expand this feedback to encompass audio hints. These would have added dynamic direction about the next available options for visitors when there was any idle time. For example, if a visitor explored touching the screen in the area of the graph, after a brief period of inactivity, the exhibit may then prompt them to, “Try holding your finger in one place on the graph for a more detailed description of data at that point.” This option allows you to divide instructions into more digestible pieces that are given when a visitor is ready for them. This kind of dynamic feedback also involves an additional layer of instruction writing and programming in the software that the scope of our project did not include.
Broadcast sonified audio
In addition to the broadcast text audio, this exhibit also includes sonified audio. These are tones that represent data values on the graphs. Similar to the broadcast audio feedback, the sonified audio is also dynamic and changes based on the current data being shown in the graph. This exhibit shows sonified trend lines in these data and sonifies the data points when a visitor moves their finger over them when touching the screen. Below are two videos showing the sonified data. We used static to represent areas of the graph in which no data is present.
This video shows when a graph is first selected. As the trend line slider moves across the screen, audio feedback plays out the values, with higher pitches representing higher values in the data. This graph goes from low to high and then plays static for the second half of the graph where no data is present.
This video shows a person moving their finger around within the graph area on the touch screen. Each tone that is played represents one data point and the pitch corresponds to its value. Static is played when the user moves her finger into an area of the graph where no data points are present.
Our decision to include dynamic audio feedback allows a wider range of visitors to interact with the graphs in this exhibit and understand the wind turbine data being presented in the graphs, but we had to be very judicious in our decisions about where use audio in this exhibit. There were a few areas in which we had to remove audio feedback because it was causing confusion.
Originally, the buttons read out an audio title of which option they represented when they were touched, but before they were even pushed. This led to visitors accidentally triggering the audio when they were interacting with another part of the exhibit and lead to confusion about what feedback corresponded with their actions. Additionally, the names of the turbines were often confusing in themselves, so having them repeated was not helpful. We added “wind turbine” with each of the brand names to reinforce the exhibit topic.
At first, we also played the broadcast audio introduction after each graph button was pushed. Some visitors felt this was repetitive, many did not listen, and some felt it was too complex to understand. Additionally, some visitors didn’t realize the same audio was being repeated and felt they should listen to it even if they already understood what to do from using the prior graph. This led us to only play the introduction audio and animation the first time a graph is chosen by a visitor, but visitor interaction is locked out during this period to reinforce their understanding of the instructions. For each subsequent graph choice, visitors move straight to interacting with the graph. If a visitor does want the introduction content, a more detailed explanation is available in the “More Audio” button. Once a visitor stops interacting with the exhibit, it times out and moves back to the idle screen. Any additional interaction would once again trigger the introduction to play.
We would like to note that visitors who are deaf can often feel the vibration of the audio and know that there is auditory information that is being shared. If they feel confused by the interactive, they will think they are missing out on critical information. All audio directions in this exhibit are also reinforced with visual text and images, in order to be accessible for visitors who are deaf.
by Emily O'Hara ![]() on December 31, 2014
on December 31, 2014